

Histograms are the unsung hero of photography and image editing and is an essential tool. But have you ever fully understood what histogram graphs are? Have you ever wondered what its use is or how it could be important to your next art project? Well luckily for you, you soon will!
Nowadays using digital equipment and software has a number of benefits, but working digitally using packages like Photoshop or a digital camera like a DSLR makes the life of an artist an easier one. Every pixel records the colours, brightness and tonal values when an image is taken with a digital camera. But how do we determine if our image is acceptable for the given task? How can we accurately know if the lighting conditions are adequate to get a well-exposed image? We use histograms.
What Are Histograms?
A histogram is a graph that shows us the total amount of a range of colours from a given image. The horizontal axis represents the entire image, from left to right the graph tells us the tonal range from black to white (0 – 255). The vertical axis represents the number of pixels with specific tonal ranges. So if your image contains darker colours (maybe you took a photo in a poorly lit room) the graph would show a lot of activity in the left hand side of the graph. To help understand the graph we can split them into three sections. Shadows to the left, midtones in the middle and highlights to the right. A well exposed image would create a symmetrical, humped like shape which smoothes out gently at either end of the histogram, the black and white points. Photographs that are poorly exposed will feature the majority of its pixels either to the far left or right of the graph.
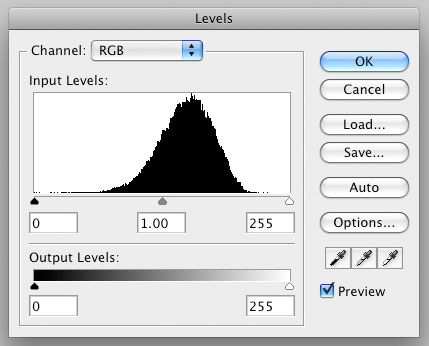
This is a good example of a histogram. The spike is evenly spread with majority of its tonal ranges in the middle. Either side of the graph smoothes out to the edges meaning the image is not over or underexposed.
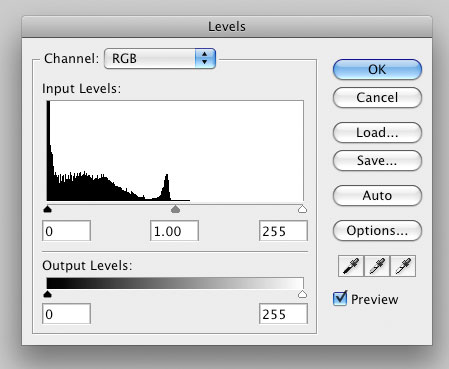
This is an example of an underexposed image, where the graph shows a large spike in the left (shadows), indicating that the image contains a lot of dark pixels. This may be correct depending on what type of image you are going for (maybe your aiming for a dark finish to your photo) but in most cases this indicates an exposed problem with your image. In some cases you may experience spikes in this area if the subject contains darker areas on a lighter background, for example someone wearing a black t-shirt on the beach.
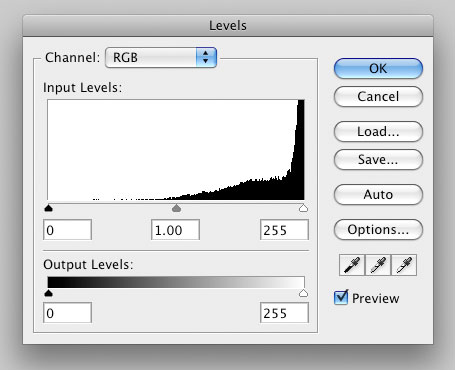
This is an example of an overexposed image, where the graph shows a large spike in the right (highlights), indicating that the image contains a lot of blown/light pixels. This is very common when taking a photo of something that contains a lot of white, maybe it’s waves crashing on the beach or the sun over a winter ski resort. In some cases you may experience spikes in this area if the background is darker than the object being photographed.
How Can Histograms Be Useful?
Viewing an image’s histogram is helpful to quickly establish if it contains any overexposed or underexposed areas known as clipped highlights/shadows. These occurrences form a spike at either end in the histogram and situations where viewing the image isn’t possible (for example, viewing an image on a digital camera’s LCD screen in bright sunshine), the histogram will tell you if you need to reset and retake the photo.
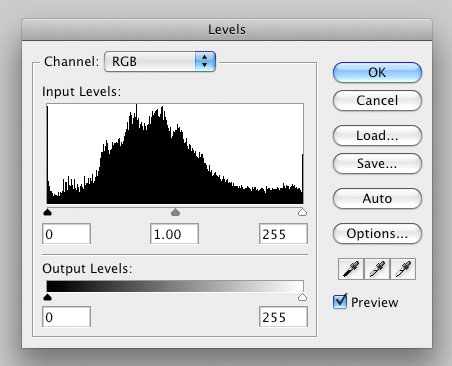
These intrusive spikes happen when an image has a wide range of tonal colours (large areas of dark shadows or bright light) and pixels are biased to one (or both) side(s) of the histogram graph. When this occurs clipped highlights/shadows will have very little detail to the point where they appear like a pure colour. If your images contain a large amount of clipped highlights, known as blown highlights, it’s near impossible to resolve in Photoshop. With this in mind it’s more important to get better exposure in the lighter areas of your images compared to the darker areas, as it is slightly easier to remedy darker areas than lighter.
With Photoshop you can easily view an image’s histogram and easily edit the shadows, midtones and highlights by going to,
Image > Adjustments > Levels
Here you will get a similar graph to what is presented to you on a DSLR. Within Photoshop you are able to adjust these levels accurately and to your preference. So next time your out shooting photos or editing images in Photoshop, you will have a deeper understanding of what histograms are and how you can use them to specifically change elements of your image.

google…
G http://images.google.com.hk/…
[…] might also find the Histogram refresh tutorial useful now you’re moving to the next stage, which will help you understand how to read your […]